

Sponsored Ad - Binance

Choose from a wide variety of options to convert your fiat into crypto:
✅ Transfer money from a bank account
✅ Buy crypto instantly with a credit/debit card
✅ Top-up via e-wallet options
The language of business is accounting. So, you MUST understand how to interpret an income statement if you want to invest in Stocks and businesses.
Here is all the information you require:
An organization's revenue and expenses over time are displayed on the income statement; a profit and loss statement or "P&L" is another name for it.
The most typical intervals of time for these statements are:
90 days / 1 quarter
365 days in a year
"Trailing Twelve Months" (TTM)
"Year To Date," or YTD
Some businesses also report 6 and 9-month periods.
In the quarterly earnings press release, companies typically include their income statement, although not always.
You can look for them by visiting:
▪️10-Q (quarterly report) on SEC
▪️10-K (annual report) on SEC
▪️Financial websites, like The Motley Fool

Step-down transitions are used in the income statement. Sales revenue (the top number) is deducted as you go down from costs.
The income statement generally looks like this in the United States (there are some exceptions):

Let's examine each one separately.
1: Revenue
This is the sum that has been received or will be received within the time frame from sales of goods and services to clients.
Sales revenue is net, which means it takes into account any discounts, refunds, and other price reductions.
2: Cost of Goods Sold (COGS)
The total costs and expenses for manufacturing the good or service are shown in this graph. If you sell calculators, these would be the variable costs for things like labor charges, plastic, memory, chips, and so on.
3: Gross Profit
The formula is Revenue - COGS
Additionally known as "gross income."
4: Operating Expenses (OPEX)
A broad category that covers all expenses related to maintaining regular business operations. Some businesses display precise costs. Others combine everything.
Research & Development (R&D), Sales, Marketing, Selling, General & Administrative (SG&A), and Overhead are examples of typical categories (rent, utilities, travel, salary, bonus, stock-based compensation)
The biggest expense for a corporation is typically OPEX.
5: Operating Income
Gross Profit - OPEX
This demonstrates how much money a business made through ongoing operations. Earnings Before Interest and Taxes, or EBIT, is another name for it.
Sponsored Ad - Semrush
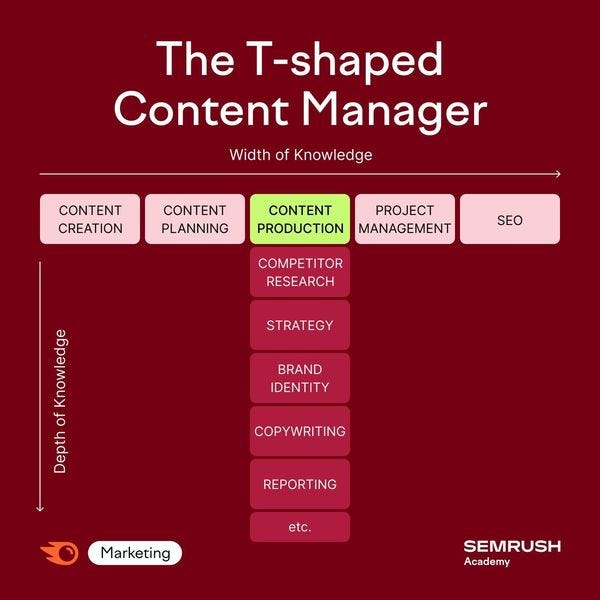
You've might have heard about a T-shaped marketer, but what about the content manager version? 🤗
A T-shaped Content Manager has knowledge and experience in many domains but is an expert in one particular type of content skill.
6: Interest Expense
Interest paid over the course of the month. Other forms of finance expenses, such as loan origination fees, may also be included. (If the business earns more interest than it pays out, this amount might even be positive.)
7: Pre-tax Income
The formula is OPEX - Interest costs
Furthermore known as "EBT" or "Earnings Before Tax".
8: Tax-related expenses
Payment of federal and state taxes
9: Net Income
We reached "the bottom line," sometimes known as "earnings" or "profits." The company is "profitable" if this figure is positive. A negative value indicates that the company is "unprofitable."
10: After determining net income, we must divide it.
A share is worth $10 if a corporation earns $10 million and has 1 million outstanding shares. Earnings per share, or "EPS," equals $10 divided by one million shares.
When income statements are compared to a comparable time, they are most helpful. You can determine whether a business is expanding or contracting using the comparison. This $NKE income statement highlights the shift to provide perspective.

Sponsored Ad - Payoneer

Bulk inventory, seasonal staff, and marketing efforts are an investment for your peak seasons. Don't worry, Payoneer can help.
Looking at each of these numbers as a percentage of revenue can also be quite beneficial. My go-to figures to check are gross margin, operating margin, and net margin. By doing this, you may compare businesses of various sizes and see how margins are changing.

Point-in-time valuations can also be determined using the income statement.
Price-to-Sales (PS ratio), Price-to-EBIT, and Price-to-Earnings (P/E) ratio are the most used metrics. Typically, 1-year data is used to derive these numbers.

We’ve come to the end of this awesome nugget. I’m sure you enjoyed this.
If you are reading this as a visitor, I’d urge you to subscribe to our newsletter below to keep getting more of this awesome content directly in your email inbox, and also share it with your friends if you feel like it.
See you at the next one!
From Our Company - C2S Academy

Learn the top in-demand skills of the century, at our academy. We have courses in Trading/Investing, Marketing, and eCommerce. Visit our Academy and enroll in any training of your choice.